RVL-CDIP-Classifier
Vision LLMs & prompt engineering
At a glance
82.6% accuracy on 1,120 images (925 correct). The slice shares at least 320 images with the 800-image slice; overlap with tuning not verified
99.4% on the 160-image slice I tuned against, so an optimistic number
29 registered prompt versions, v0 to v19
≈ $0.0004 per image for the main model
The problem
RVL-CDIP is the standard benchmark for document-type classification: scanned pages from a tobacco-litigation archive, sorted into 16 classes such as invoice, memo, letter and budget. Models trained for it usually need labeled data and a fine-tuning pipeline. I wanted to know how far a general-purpose vision model could get with no training at all, using only the prompt, and what that would cost.
Approach
The model gets the page image and a long written prompt. The prompt names the 16 classes and then walks through an ordered list of checks, so that a page is judged by what it does rather than what it is about. I changed the prompt one version at a time and scored every version the same way, so each change could be traced to a number.
What I built
- Preprocessing tools. A document processor converts TIFF and PDF pages to 300-DPI grayscale images and runs Tesseract OCR to get text with bounding boxes.
- The classifier path. The evaluated classifier does not use that OCR output. It sends the vision model only a 1024×1024 grayscale image plus the prompt, through OpenRouter.
- Versioned prompts.
src/prompts.pyholds every version, append-only, with a registry I can query by name. - Evaluation harness. Balanced, deduplicated slices of the dataset, exact-match scoring, per-class tables, confusion matrices, billed-cost tracking, and a Monte Carlo module that simulates voting and routing on top of the measured results.
- Tests. 318 test functions across 21 test files.
Results
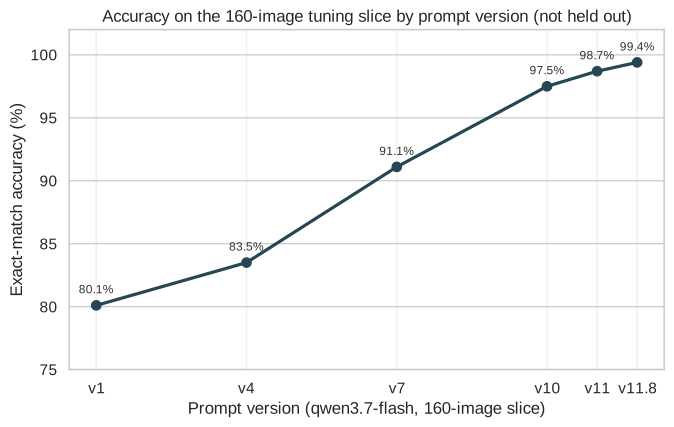
On the 160-image slice, accuracy climbed from 80.1% at v1 to 99.4% at v11.8. That is a tuning-slice number. I read the misses on that slice and wrote rules for them, so it overstates what the prompt can do on pages it has not seen.
The honest headline comes from larger slices. The same v11.8 prompt scored 82.6% on a balanced 1,120-image slice. That slice is a seeded, class-balanced sample of 70 images per class from the Hugging Face mirror of RVL-CDIP, which holds 100 per class across its three splits. The 800-image slice is the mirror’s train split (50 per class), so the two slices share at least 20 images per class, 320 in all, and the 83.1% and 82.6% results are not independent. I did not verify whether the 1,120-image slice shares images with the 160-image tuning slice. Across slice sizes it scored 87.2% at 320 images, 89.1% at 476 scored images, and 83.1% at 800. On that 800-image slice, the untuned v0 prompt scored 66.1%, so the prompt work is worth about 17 points on that slice. I did not check whether the 800-image slice shares images with the 160-image tuning slice either.
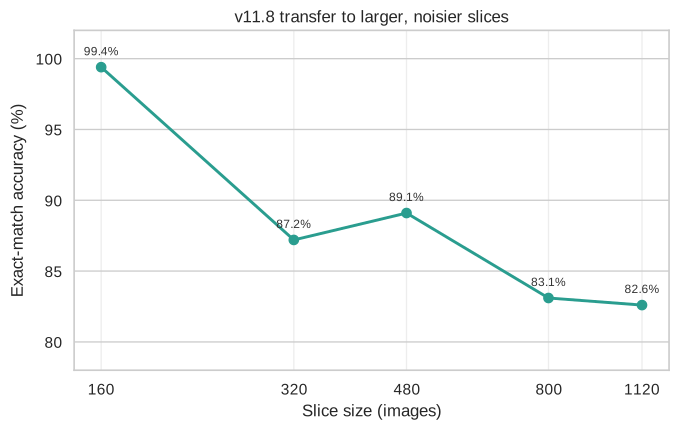
Heads up. The 160-image points in both charts come from the slice I iterated on. The 1,120-image point is the one to quote. The 1,120-image slice shares at least 20 images per class with the 800-image slice, so those two results are not independent evidence. I did not check it against the 160-image tuning slice or the other earlier slices, so it may share images with them. Treat it as a better estimate than the tuning slice, not as a clean test.
Where it fails is consistent. Budget (67.1%), letter (70.0%), presentation (70.0%) and scientific report (71.4%) are the weak classes on the 1,120 run, and the most common single error is letter predicted as memo (16 cases). In 72 of the misses, the correct class was the model’s own runner-up.
What the simulations showed
The repository’s Monte Carlo scripts treat every recorded run as a draw from a per-image distribution of answers, then resample it to ask “what if” questions without spending any model credits. They work on a pooled corpus of 5,599 rows covering 1,512 images from 18 experiments. The corpus mixes prompt versions and models, so its 82.1% baseline is a pooled rate and not the best prompt’s accuracy. For the same reason, a “read” in the voting forecast is a draw from that mixed pool, not a repeat of one fixed classifier.
| Question | What the simulation said | What I measured |
|---|---|---|
| Would majority voting help? | Forecast from the pooled, mixed-model corpus: 7 reads, 85.0%; 25 reads, 86.3%. Cost assumed to scale with the number of reads. | Not tested on a live run. |
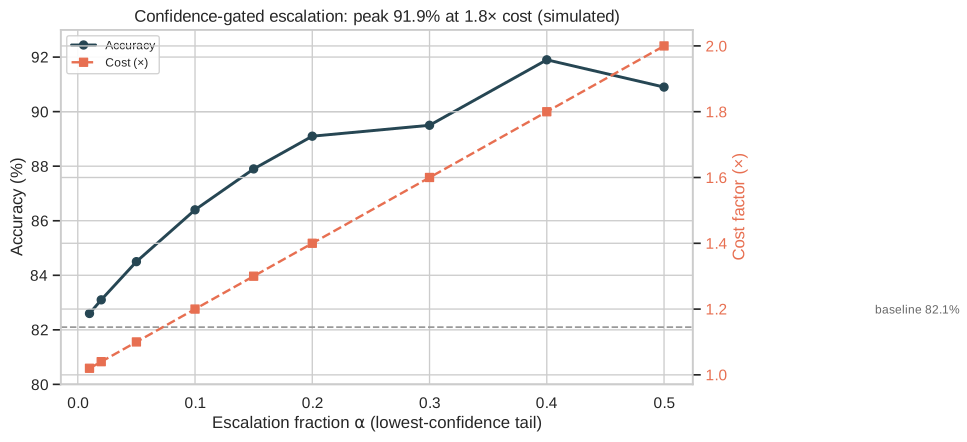
| Would sending the least-confident pages to a stronger model help? | The least-confident 40%: 91.9% at 1.8 times the cost, if the stronger model is 90% accurate at 3 times the cost. | Down, not up. On a 48-image low-confidence slice, 66.7% became 62.5%. On the tuning slice, v19 went from 97.5% to 96.9% at 7.8 times the cost. |
| Would a few worked examples for the commonest confusions help? | About 4.3% of errors fixed (33 of 767). | Down. On a 48-image slice, 68.8% became 64.6%. |
| Which prompt changes were real? | A paired bootstrap on shared images puts v0 to v11.8 at +13.0 points (95% interval 10.1 to 15.9, 898 images). | This one is a test of measured runs, not a forecast. |
| Would retries and a fallback model cover API failures? | With a fallback, 0.11% of calls fail, against about 2.9% without one. Extra retries barely matter. | Modelled only. |
Four findings stood out.
- Voting fixes noisy errors, not consistent ones. The simulated gain concentrates in classes like handwritten (84.1% to 90.8% at 25 reads). Letter barely moves (74.2% to 75.7%) and budget stays near 70%. When the model is wrong about a page every time, asking again does not help. The method also resamples recorded runs, and only 945 of the 1,512 images have more than one, so the rest cannot change.
- The confidence ranking found hard pages, but the stronger model did not fix them. The 48 lowest-confidence pages scored 66.7% on the base run, against 82.1% pooled, so the ranking was informative. When I routed the tail to a stronger model on the tuning slice, 15 pages went through, one answer changed, and it changed to a wrong label. A sensitivity sweep says the plan needs the escalated model to be better on exactly those pages (89.9% to 93.9% at 40% escalation for a 5-point swing either way), and neither escalation I tried was.
- Most of the prompt gain came early. The jump from the baseline prompt to a rule-based one is real. The later versions are statistically indistinguishable from each other: v11.8 against v16 on 319 shared images is 89.0% against 90.0%, with an interval from about -5 to +3 points. The +28.4-point gain for v17 over v0 is measured on 155 images from the tuning slice, so I quote the 898-image figure instead.
- Errors cluster in a few pairs. Budget read as invoice (63 cases), letter as memo (63), specification as form (52) and invoice as form (51) are the largest confusion pairs in the pooled corpus.
I also mined the reasoning traces for the words that appear when the model stops checking early. The prompt works through up to 14 checks in order, and the typical trace stops at check 9.4. Words such as “minutes”, “routing” and “variance” show up in traces that stop early and are wrong far more often than the 17.1% baseline error rate. Each appears in only 10 or 11 traces, so these are leads to test and not findings.
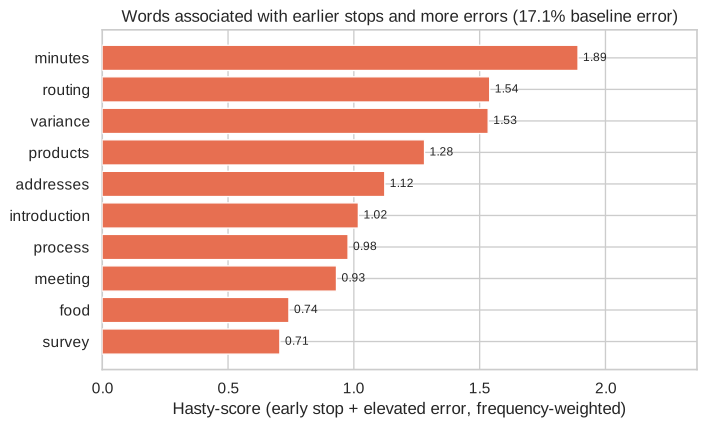
Heads up. These are resampled results from recorded runs, not new experiments. Two of the forecasts I tested by measurement, routing and worked examples, and neither held up. Voting and the failure model are untested, and the word list rests on small counts. The report has the full tables.
Explore the data and tools
The repository ships the tooling I used to look at the data and to watch the runs, and a Quarto site that pulls the results together. The site renders offline with no model spend.
- The Quarto documentation site has the manuscript, methods, results and experiment logs, the prompt changelog, cost analysis, short research memos, notebooks and a misclassification appendix.
- Monte Carlo pages are ten pages covering the analyses behind this section, and the raw reports hold the tables, including voting, routing, prompt ablation, the failure model, exemplar mining and the word analysis.
- Interactive pages include a cost calculator and an experiment explorer.
- Data exploration scripts profile the dataset: class balance, image dimensions, file sizes, color modes and sample grids.
- Braintrust tooling builds the datasets, runs evaluations that are logged as Braintrust experiments, and writes summaries, reports and metric charts. The Monte Carlo scripts live there too.
- Notebooks walk through setup, balanced sampling and upload, evaluators over a full experiment, and cost.
What I learned
- Tuning accuracy is not accuracy. Fixing named misses one by one pushed the tuning slice to 99.4% while larger slices stayed in the low 80s. Later versions made this worse in places: a longer v16 prompt dropped to 96.2% on the tuning slice and scored 83.8% and 79.4% on two fresh slices.
- Simulation needs a measurement behind it. The Monte Carlo model suggested sending the least-confident pages to a stronger model. When I ran that, accuracy went down slightly (96.2% to 94.3% on the tuning slice) at about 7.5 times the cost.
- More resolution did not help. Full-size 2550×3300 images doubled prompt tokens and did not improve accuracy in an early comparison.
Stack
Python OpenRouter Vision-language models Prompt engineering Tesseract OCR Monte Carlo simulation Braintrust Quarto Error analysis pytest
Credits
Built with co-author Grant Mooslin, advised by Siddharth Suresh. The dataset is RVL-CDIP (Harley, Ufkes and Derpanis, 2015).